News
Wind Farm Underperformance: Understanding Icing-Related Losses
The wind farm industry, while promising for sustainable energy, struggles with a persistent challenge—underperformance. Wind farm performance predictions often fall short, impacting management and financial decisions.
Understanding Wind Farm Underperformance

Daniela Roeper
Vice President BorealisWind
Wind farm underperformance can be attributed to various factors, and among them, icing has a significant impact on cold climate wind farms. The financial implications for incorrectly assessing wind farm production can be substantial, and in the most severe cases can lead to unprofitable projects, compelling owners and executives to take a closer look at solutions to address underperformance and maximize production for the most ROI.
Addressing underperformance issues due to icing isn’t just meeting or exceeding the predicted performance targets set during initial assessments. It extends to the broader goal of optimizing wind farm efficiency and ensuring safety for surrounding people and property. Avoiding unexpected issues due to ice build-up that can damage the organization’s reputation or future opportunities is essential for growing the business.
According to a 2016 research article in the Journal of Physics, “icing can result in up to 17% loss in Annual Energy Production (AEP)” for wind turbines in cold climates. Since this report has been published, even higher losses (40%) have been measured at several sites in Canada. If icing issues have been incorrectly calculated for a wind farm, they could be losing significant revenue due to underperformance and spending more on maintenance, service, and other issues.
The Challenge of Icing in Wind Farms
The consequences of underproduction due to icing are not only financial but also regulatory. Meeting performance targets becomes crucial for compliance and maintaining operational integrity, as well as minimum energy production requirements.
Icing on turbine blades is an underestimated issue. The prevailing misconception—that icing isn’t a significant problem—leads to expensive, short term, ineffective solutions that mask the problem rather than solving it.
Affordable solutions often fall short of expectations, while more effective options are deemed too expensive or unsustainable. This balance between cost and efficiency adds complexity to the challenge, leading many wind farm operators to take their chances when it comes to ice.
Accurate Icing Assessment Solutions
Icing assessments specifically designed to support cold climate wind farms offer important, expert insight based on actual data from around the world. Unlike traditional meteorological approaches, these assessments delve deeper, considering factors like icing duration and turbine impact which can affect the overall life of the turbine and its components.
The WIceAtlas is one resource that provides high level information about icing severities including expected production losses, ice throw risks, and turbine lifetime. Their data is based on more than 20 years of measurement and observation data from more than 4000 meteorological stations positioned around the world. According to WIceAtlas, “by analyzing extensive historical icing weather conditions, it is possible to estimate the resulting long-term iced turbine production losses thus giving valuable AEP estimates for financial calculations.” This tool offers a helpful starting point for estimating production losses, but it may not have specific information about the microclimate you’re located in. Consulting an icing expert can help you assess your actual losses and provide solutions that can help you maximize energy production during icing season. The significance of assessing icing in wind farms cannot be overstated. It is a key step toward unraveling the complexities of underperformance and getting the most out of your wind turbine to meet financial goals and regulatory requirements.
Wind farm Site Managers and Directors of Operation should explore icing assessments and data to enhance the efficiency and production of your wind farm. The path to optimized performance starts with a comprehensive understanding how icing on turbine blades is estimated and finding the experts who can help.
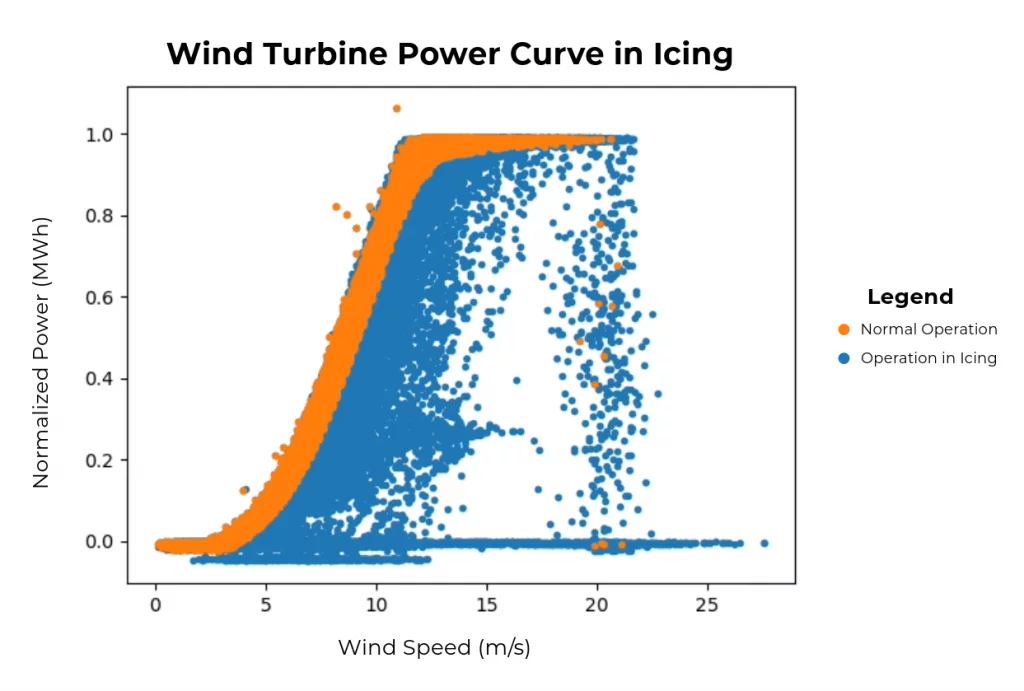
This graph illustrates turbine power production relative to wind speed, contrasting normal operation in orange with icing conditions in blue. The broad range of turbine performance during icing conditions complicates predictions and detection of underproduction. Identifying points of underproduction due to icing is challenging, especially within the mid-range where the turbine may not immediately recognize significant underperformance until it becomes substantial. The graph underscores the difficulty in pinpointing and mitigating the impact of icing on turbine efficiency.
Additional Information
BorealisWind Ice Protection Systems
Connect with an expert to assess your turbine performance