Test results
Predicted vs. measured conditions and results
Example 1
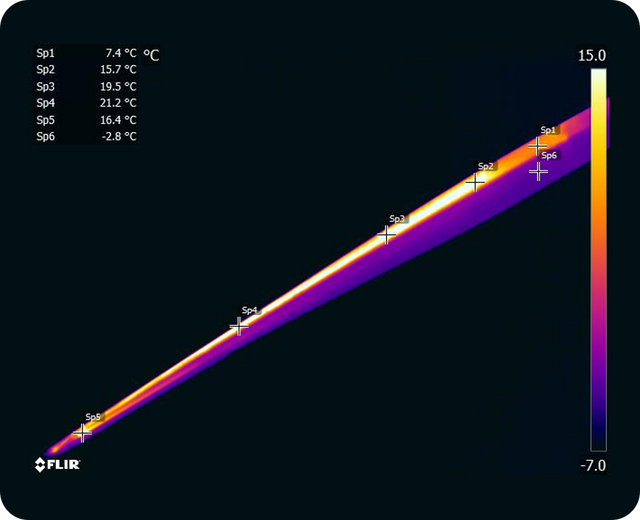
This image shows a heated 50 meter long blade. This is an infrared photo taken from the ground of an 80 meter tower. The heating is targeted to the leading edge of the blade, which you can see from the spot temperatures. The leading edge shows a temperature between 15.7°C and 21.2°C depending on the location. Due to the distance that the infrared photo was taken from, there may be +/-2°C of error.
This table shows the predicted temperatures and the measured temperatures. The ambient conditions where -2°C degrees Celsius with wind speed around 2.2 m/s. The predicted blade surface temperature was between 14.5°C to 20.0°C.
Example 2
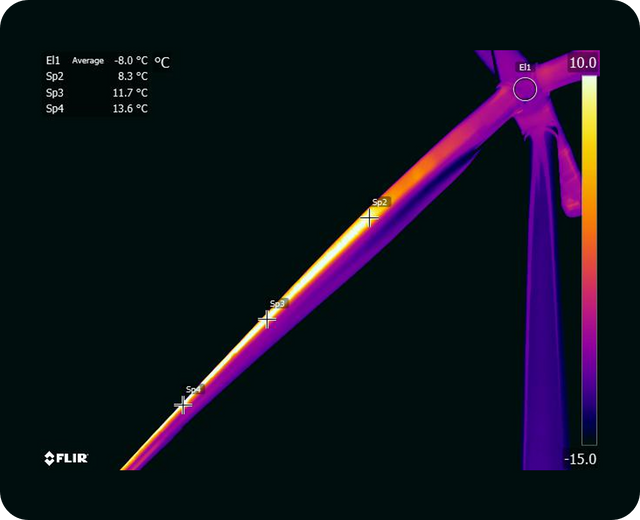
This image shows a heated 50-meter long blade. This is an infrared photo taken from the ground of an 80-meter tower. The heating is targeted to the leading edge of the blade, which you can see from the spot temperatures. The leading edge shows a temperature between 8.3°C and 13.6°C depending on the location. Due to the distance that the infrared photo was taken from, there may be +/-2°C of error.
This table shows the predicted temperatures and the measured temperatures. The ambient conditions where -7°C degrees Celsius with wind speed around 5.8 m/s. The predicted blade surface temperature was between 6.3°C to 12.9°C.